2024 State Of New American Citizenship Report
A report by Boundless uses public data to understand national trends in the government’s handling of citizenship applications
KEY FINDINGS:
- In some parts of the country, if an eligible green card holder applied for citizenship in July 2024, they could conceivably be approved in time to vote in the November presidential elections.
- The top four states with the largest population of lawful permanent residents eligible to become U.S. citizens are California, New York, Texas, and Florida.
- The Biden administration has made huge progress in streamlining the application process and making it more efficient.
- By the end of May 2024, the average processing time for a citizenship application had dropped to 5 months — a 15% drop from the previous year and a more than 50% decline from 2022.
- USCIS, the federal agency responsible for processing citizenship applications, is finally getting a handle on the skyrocketing backlog of applications in recent years. In 2023, the agency faced a backlog of 416,034 citizenship applications, a 44% decrease from the high of 942,669 in 2020 and the lowest the backlog has been since 2015.
As of January 2023, 12.7 million immigrants in the United States are lawful permanent residents (green card holders) eligible to apply for U.S. citizenship. Of that number, 9 million are eligible to naturalize, a decrease of roughly 200,000 since January, 2022 due to the large number of naturalizations that year, largely the result of the pandemic rebound.
Naturalization is the process by which an immigrant becomes a U.S. citizen. It has considerable economic benefits at the individual, regional, and national levels. Naturalized immigrants earn around 10% more in annual income than non-naturalized immigrants (controlled for skills, education, and fluency in English), suggesting that naturalization, which gives skilled immigrants the long-term freedom to live and work in the United States, makes them more attractive to employers and lead to higher-paying jobs.
A 2015 study in 21 U.S. cities found that if all eligible immigrant residents were to naturalize, their aggregate income would increase by $5.7 billion, leading to an increase in homeownership of more than 45,000 people and a $2billion increase in tax revenue.. If just half the eligible immigrant population of the United States naturalized, the increased earnings and demand for home ownership could boost the nation’s GDP by $45 billion per year.
The Biden administration has pushed to make naturalization more accessible to eligible immigrants, resulting in shorter wait times and a decrease in the application backlog. More recently, Biden announced a sweeping executive order that would provide temporary legal status to roughly 500,000 undocumented spouses of U.S. citizens, providing them with a pathway to citizenship.
However, if Donald Trump is elected president in 2024, many of these gains could be stripped away. On the campaign trail, Trump has already said he would end birthright citizenship and deport between 15 and 20 million undocumented immigrants.
The outcome of the election could therefore carry grave consequences for immigrants and their families.
Expect a surge in naturalization applications in 2024 due to the presidential election
The volume of applications received each year does vary, but only slightly. However, ahead of elections, the number typically does increase more significantly. From July through September 2020, citizenship data shows that nearly 35% more people applied for U.S. citizenship than during the same period in advance of the 2016 election. Boundless estimates that nearly 300,000 would-be citizens should have been eligible to vote in the 2020 elections— including many Senate runoffs— but couldn’t due to the suspension of naturalization services.
There will likely be a surge again in 2024 ahead of the elections. Processing times for naturalization applications have dropped significantly, meaning that someone who applies for citizenship in July, 2024 could conceivably become a citizen in time to vote in November, depending on where they live.
Processing times are finally dropping as USCIS recovers from the COVID-19 pandemic
Applicants are finally seeing some reprieve from long wait times. In 2024, the processing time for a citizenship application averaged 5 months — a 15% drop from the previous year and a more than 50% decline from 2022.
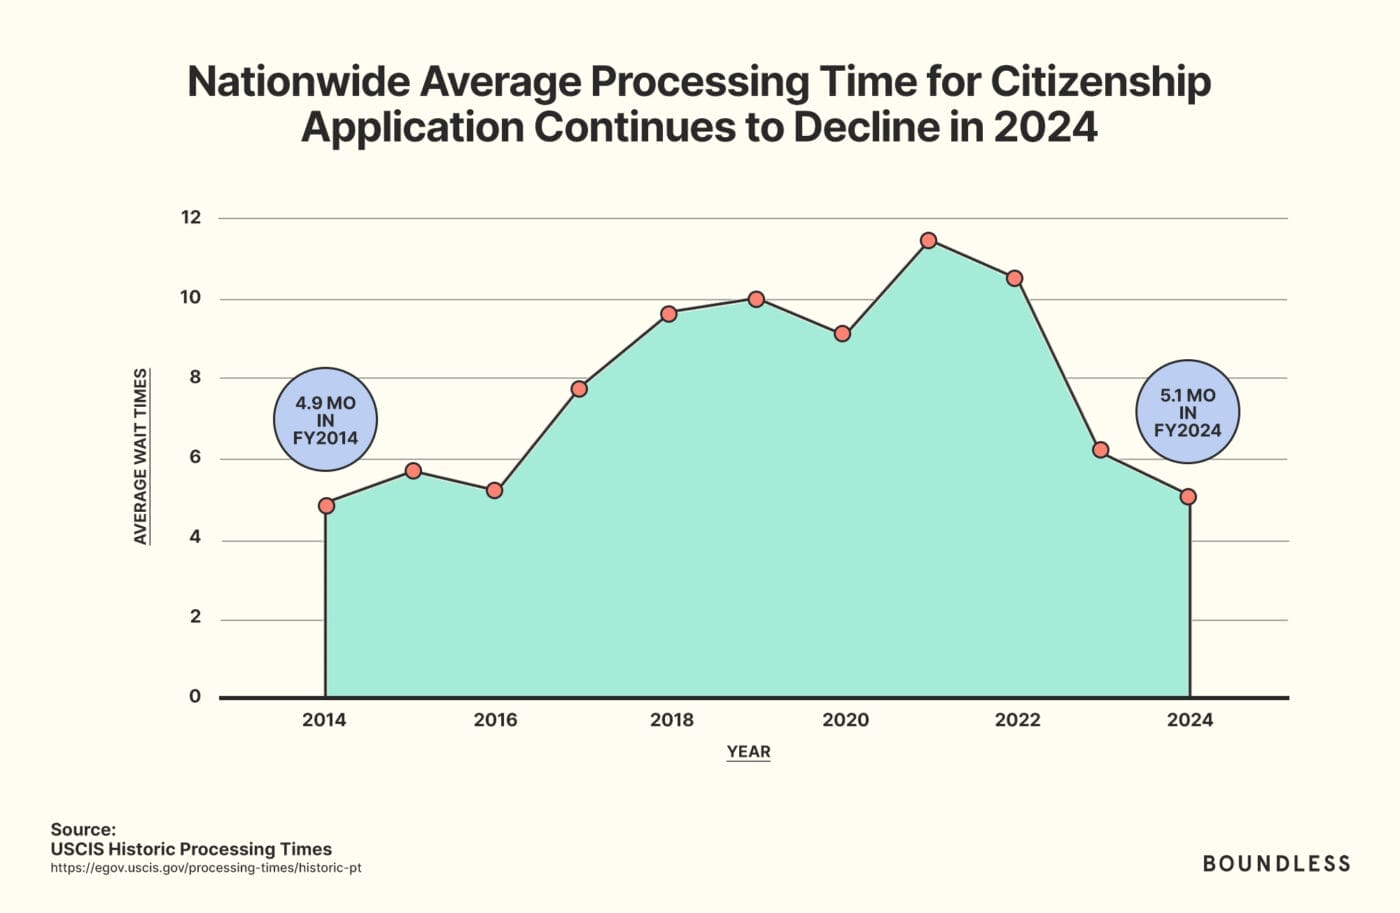
Between 2012 and 2016, median application processing times hovered between about 4.5 to 6 months, before shooting past 8 months in 2017 and hovering at about 10 months in 2018 and 9 months in 2020. Compounding the worrisome trend, starting in March 2020 the coronavirus lockdown postponed the final steps for naturalization—interviews and oath ceremonies — until offices reopened in June 2020. That led to record wait times in 2021 (11.5 months) and in 2022 (10.5 months).
BACKGROUND
On March 18, 2020 — due to COVID-19 — USCIS stopped conducting in-person interviews and oath ceremonies for immigrants seeking to become naturalized citizens. These immigrants had already made it through most of the naturalization process after many months—sometimes years—of waiting when the naturalization process was halted. Nationwide, there were well over 100,000 naturalization applicants already stuck in limbo, with thousands more piling up by the month.
These processing times kept rising because the government could not keep pace with the volume of incoming applications, which only got worse as the COVID-19 pandemic led to reduced staff, hours, and capacity. After a 2-year spike in 2016–2017, the volume of citizenship applications fell slightly in 2018 and 2019, only to once again surge to historic levels in 2020.
In FY 2023, almost 12% of all citizenship applications received resulted in a denial. This rate of denial was about the same a decade ago – 13% in 2009 – and fell briefly in the last few years, but following the pandemic, it rose sharply again.
The rate of denial is roughly six times higher than the denial rate in the early 1990s. Possible reasons include stricter vetting following the 9/11 terrorist attacks and an increase in the number of citizenship applications. Typical reasons for why a citizenship applicant might be denied include:
1.) An applicant filed too early, before they were eligible
2.) They did not meet the residence requirement (lived abroad or too overseas trips that were too long), and
3.) Failure to meet the good moral character requirement (criminal issues, tax problems, etc.)

Even before the delay from COVID-19, immigrants seeking naturalization faced an uneven, challenging landscape. USCIS field offices around the United States handle naturalization applications differently, with dramatically different processing times.
Immigrants in some cities face processing wait times more than double than in other cities. In Charleston, South Carolina, the average processing time in May 2024 was 13 months, whereas in Cleveland, Ohio, an application could be processed in 5.5 months. Some cities, like New York, Miami and San Francisco, have four or five government field offices where immigrants can attend their citizenship interviews. Many other cities – predominantly in the Midwest – have no field offices at all, and immigrants sometimes have to travel more than 150 miles to the nearest one.
The chart below shows median and maximum wait times for USCIS field offices serving a given metro area.
Between May 2023 and May 2024, the city with the fastest processing time was Cleveland, Ohio, which currently averages 5.5 months to process a citizenship application. The city with the slowest processing time is currently Charleston, South Carolina, which took on average 13 months to process a citizenship application in May 2024, followed by Norfolk, Virginia, and New Orleans, Louisiana.

In 2023, the top four states with the largest population of lawful permanent residents eligible to become U.S. citizens was California, New York, Texas, and Florida. These states accounted for nearly 60% of all lawful permanent residents eligible to naturalize in 2023.

In 2023, more than 25% of eligible to naturalize green card holders were from Mexico, followed by China (6%), Cuba, the Dominican Republic, and the Philippines (all 4%).

However, only a small percentage of the eligible to naturalize population become U.S. citizens in 2023.

Nationwide, is it getting easier or harder to become a naturalized U.S. citizen?
USCIS, the federal agency responsible for processing citizenship applications, is finally getting a handle on the skyrocketing backlog of applications in recent years. In 2023, the agency faced a backlog of 416,034 citizenship applications, a 44% decrease from the high of 942,669 in 2020 and the lowest the backlog has been since 2015.
The Biden administration has made great strides in making the naturalization process easier and more accessible:
1.) Starting in 2022, USCIS prioritized naturalization applications, leading to a massive drop in processing times.
2.) Modernizing the way naturalization applications are processed. The majority of citizenship applications are now processed via online filings instead of paper, marking USCIS’ most successful digitization effort to date.
3.) Increased resources and grant programs informing the public about the naturalization process, which has led to a more even distribution of filing dates, reducing the clustering of applications typically seen around election years.
4.) In October 2021, the Biden administration announced the elimination of the fee for Form N-400 for eligible applicants, which was a significant financial barrier for many immigrants seeking citizenship.
5.) The administration rolled back Trump-era policies that had tightened eligibility criteria for fee waivers, making it easier for low-income immigrants to qualify for financial assistance when applying for naturalization.
BACKLOGS IN CONTEXT
In 2007, citizenship applications surged to nearly 1.4 million, far higher than in recent years. This was driven in part by a looming 80% application fee hike that year, and an increase in newly eligible immigrants who had obtained their green cards 5 years earlier under the Legal Immigration Family Equity (LIFE) Act of 2000.
USCIS responded with a surge in processing volume the following year, and the backlog plunged to a 30-year low of about 257,000 in 2009.
In the mid-1990s, there was a truly “record and unprecedented” surge in citizenship applications, driven in part by a corresponding increase in newly eligible immigrants who had received green cards under the Immigration Reform and Control Act 1986 (IRCA, also known as the “Reagan Amnesty”). Between 1995 and 1998, application volume stayed well above 900,000, peaking at over 1.4 million in 1997. Although the backlog initially shot past 2 million in 1997-1998, USCIS responded with a comparable surge in processing volume that appears to have tamed the backlog by 1999-2000.
The data indicate that when USCIS devotes sufficient resources to a citizenship application surge, it is possible to dramatically reduce the backlog within one year. That’s what happened in 2000, 2007, 2012, and again in 2023.
On the other hand, when USCIS fails to devote sufficient resources, backlogs can get way out of hand. That’s what happened in the mid-1990s and in 2020.
Another way to evaluate this problem is to measure how efficiently USCIS beats back its backlogs. If USCIS processed every citizenship application it received in a given year, plus the applications that were pending from the previous year, that would yield a “backlog completion” rate of 100%.
In reality, USCIS achieved a backlog completion rate of 77% in 2009 — a 30-year high — and this number has been trending downward ever since. There was a 10-point drop in backlog completion between 2016 and 2017 (from 63% to 53%), but backlog completion crept back up to 67% in 2019 before falling drastically in 2020 to 47%, which was the lowest backlog completion rate since 2007 (39%).
By the end of fiscal year 2023, however, the rate at which USCIS was completing naturalization cases had recovered somewhat, to just under 64%, a big improvement from 52% in 2021.
Conclusion
By illuminating national and local trends in new American citizenship, we hope that this report is useful to immigrants, advocates, and state and local government leaders seeking to make the naturalization process more navigable and equitable.
Going forward, Boundless will continue to watch for new trends in the data on U.S. citizenship:
- Will naturalization rates rise or fall, both nationally and locally?
- Will backlogs and wait times continue to fall?
- Will disparities among metro areas and USCIS field offices persist over time?
Methodology
DATA SOURCES
The following data sources were used in this report:
Yearbook of Immigration Statistics 2022
U.S. Naturalizations 2022: Annual Flow Report
Immigration and Citizenship Data U.S. Citizenship and Immigration Services. “Form N-400, Application for Naturalization, by Category of Naturalization, Case Status, and USCIS Field Office Location” [several quarters].
Historical National Average Processing Time for All USCIS Offices. U.S. Citizenship and Immigration Services.
Archive Data Set: Form N-400 Naturalization Average Cycle Time. U.S. Citizenship and Immigration Services.
Check Case Processing Times. U.S. Citizenship and Immigration Services.
Field Offices. U.S. Citizenship and Immigration Services.